Congress Signal Lab: Reading Portfolios Like Documents
An information-retrieval idea led to an original annual backtest of +32.26%, versus +11.05% for SPY: a difference of 21.21 percentage points after modeled costs. That result made me want to understand the behavior behind it—and build a small research toolkit that others can inspect.
Research status: These are hypothetical results from the original implementation, with known TF-history and security/execution defects. The evaluation overlaps historical parameter selection and is not out-of-sample. Corrected annual results are pending. The number is a reason to investigate, not evidence of a validated trading edge. This article is for research and education, not investment advice.
Explore Congress Signal Lab on GitHub · Read the audit
What if a portfolio were a document?
Looking through public repositories and datasets that track congressional stock-trading disclosures, I kept coming back to an information-retrieval question: how do we distinguish a meaningful pattern from the background?
In a collection of documents, common words are poor clues to what makes a particular document distinctive. A term that appears repeatedly in one document but rarely elsewhere can tell us more. TF-IDF—term frequency multiplied by inverse document frequency—formalizes that intuition. TF rewards repetition within a document; IDF discounts terms that are common across the collection.
Now imagine that a member’s disclosed buying history is the document, and a stock ticker is a token. Broad-market funds such as SPY and QQQ illustrate the intuition: exposure shared by many investors says relatively little about any one investor’s distinctive behavior. They are conceptual examples here, not the intended stock-buy universe of this experiment; the audit also found that asset classification needs stronger checks.
The question becomes: what is this person repeatedly buying that relatively few other members are buying? That is a more specific research question than simply copying the newest disclosed transaction.
Turning the analogy into a ranking
The intended TF feature counts distinct earlier transaction dates on which a member bought a ticker. Multiple records from one transaction date should not automatically count as multiple independent expressions of interest. IDF compares how many members were buying any eligible stock with how many were buying that particular ticker.
The annual experiment combined that idea with two other features:
- Freshness: Older transactions received less weight because disclosure delays can reduce how informative a trade is by the time it becomes visible.
- Recent buying consensus: Additional distinct buyers in a recent window increased a ticker’s score. A stock can be unusual across the broader historical population while attracting a small cluster of recent buyers.
Committee or policy relevance is a separate hypothesis. It was not included in this annual experiment. Any future version would need dated committee assignments and a defensible mapping between those responsibilities and company activities.
There is an important implementation distinction: the original annual program collapsed some records before counting historical transaction dates. The audit found that this lost part of the intended TF history. The portable package retains distinct dates, but it must not inherit the old portfolio return without a corrected annual rerun.
The original 365-day experiment
The study covered November 7, 2025 through November 6, 2026, comprising 251 SPY sessions. It used an Austin congressional-trade dataset snapshot and adjusted Yahoo daily price bars. The disclosure timestamp was a retrospective filing-day proxy, not a recorded first-publication timestamp for every event.
The annual simulation selected one ranked signal per filing day, entered at the next session’s open, and held for ten sessions. It modeled 10 basis points of costs per side, with up to 20% of initial capital allocated to each filing-day cohort, constrained by available cash. There was no margin borrowing. Five positions still open at the end were marked without modeled exit fees.
| Original ranking | Net return | Difference vs. SPY | Max daily-close drawdown |
|---|---|---|---|
| Freshness | +5.63% | −5.42 pp | 17.90% |
| TF-IDF | +28.49% | +17.44 pp | 9.94% |
| TF-IDF + consensus | +32.26% | +21.21 pp | 9.85% |
| SPY buy and hold | +11.05% | — | 8.88% |
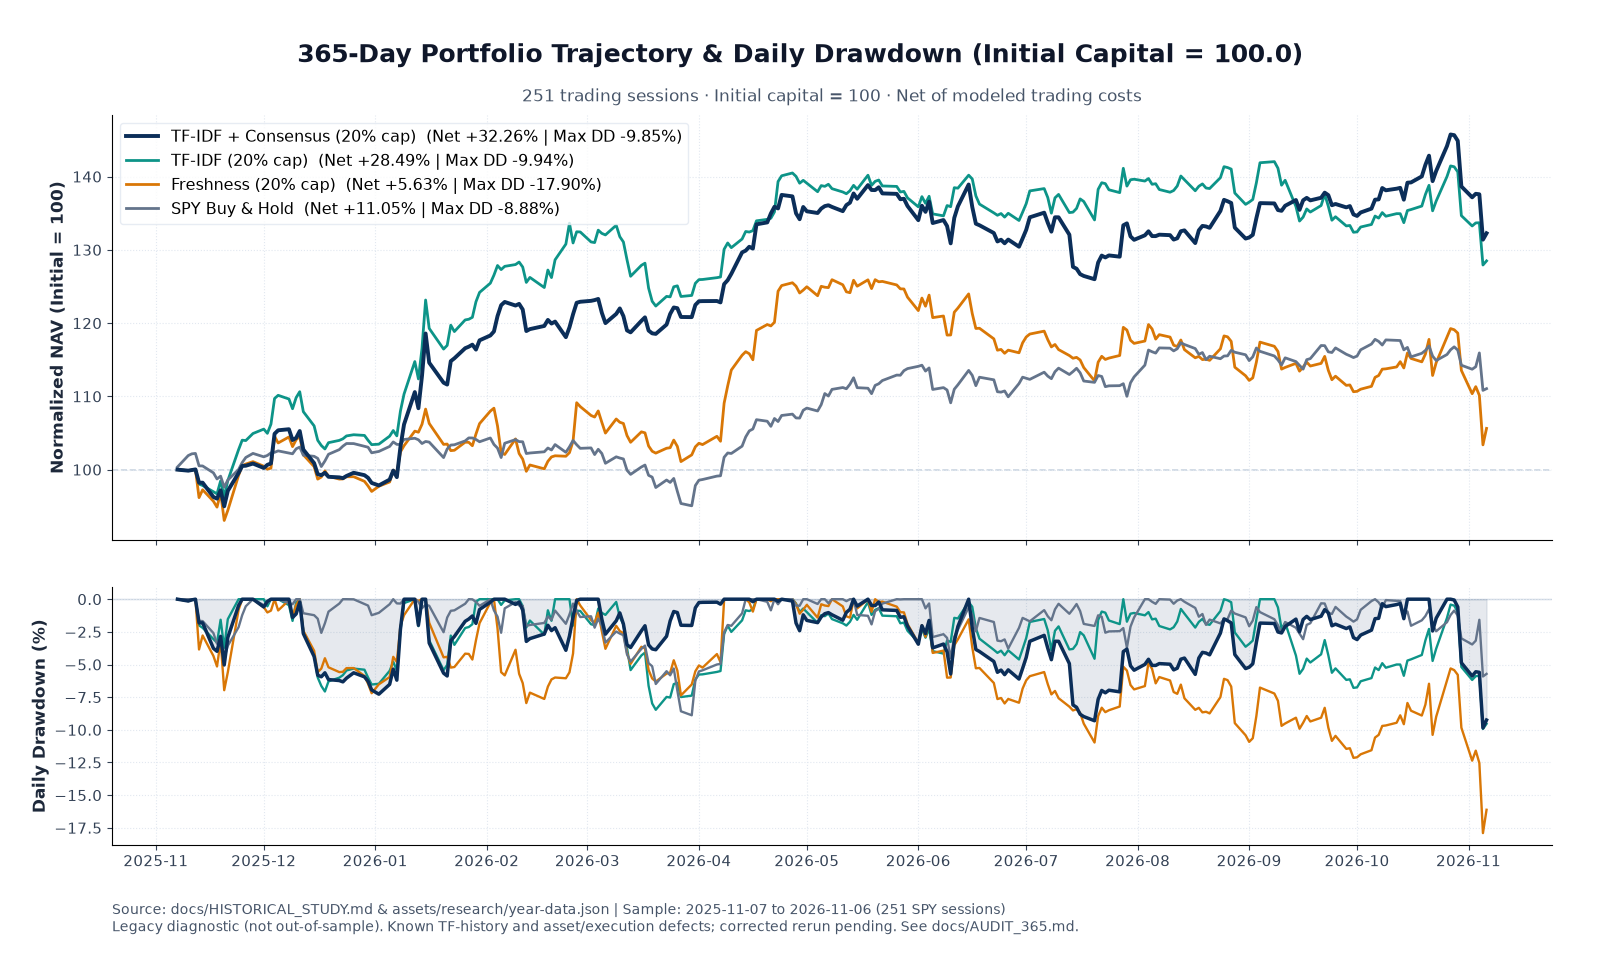
The contrast with freshness alone is interesting: in this implementation and historical window, the latest disclosed trades were not enough to beat SPY. The relationship between repeated behavior and cross-member rarity deserves further study. These comparisons do not establish causality or risk-adjusted alpha, and the unresolved defects prevent treating them as a clean test of the corrected idea.
Monthly outcomes and return drivers
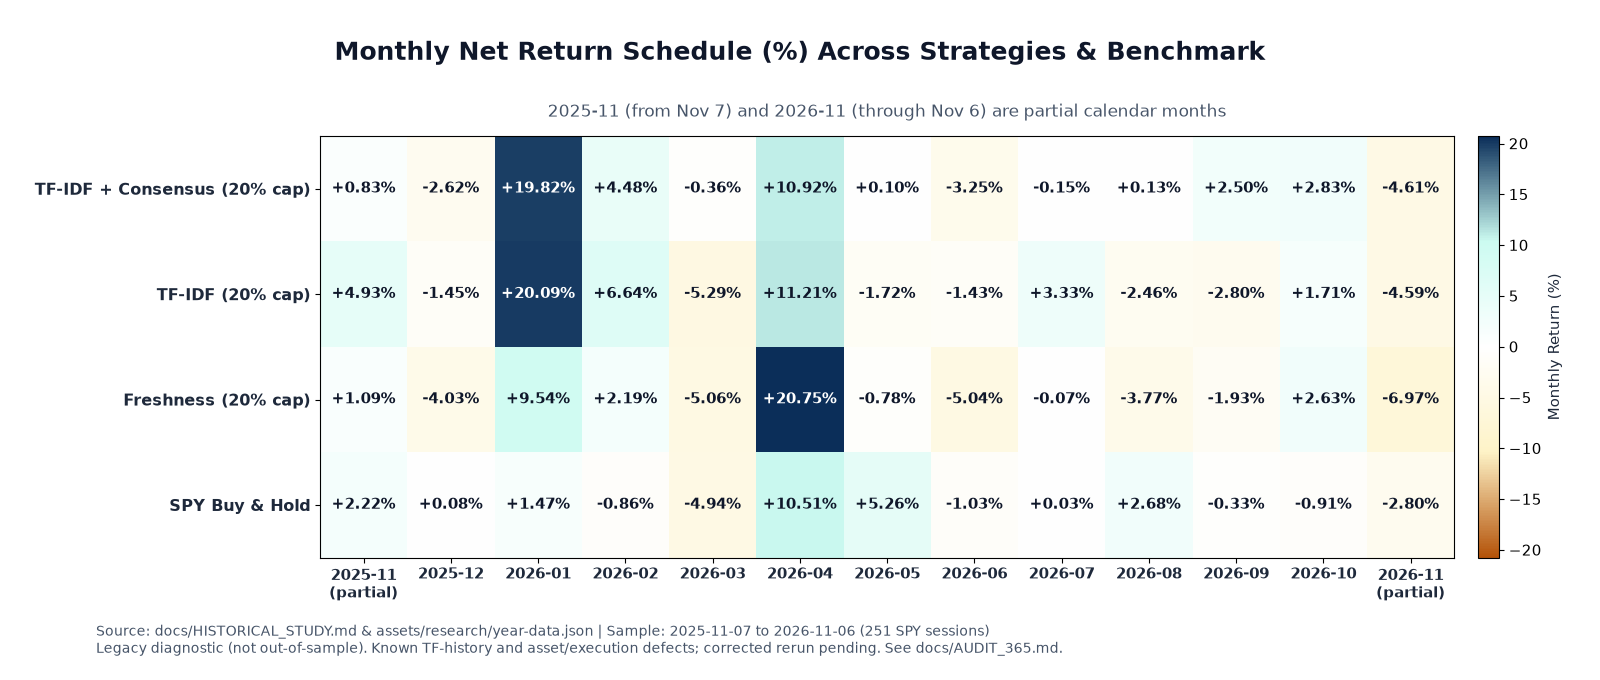
January 2026 returned +19.82%. The consensus variant beat SPY in 6 of 13 monthly buckets, with the first and last November buckets covering partial months. Returns arrived in bursts rather than consistent monthly outperformance.
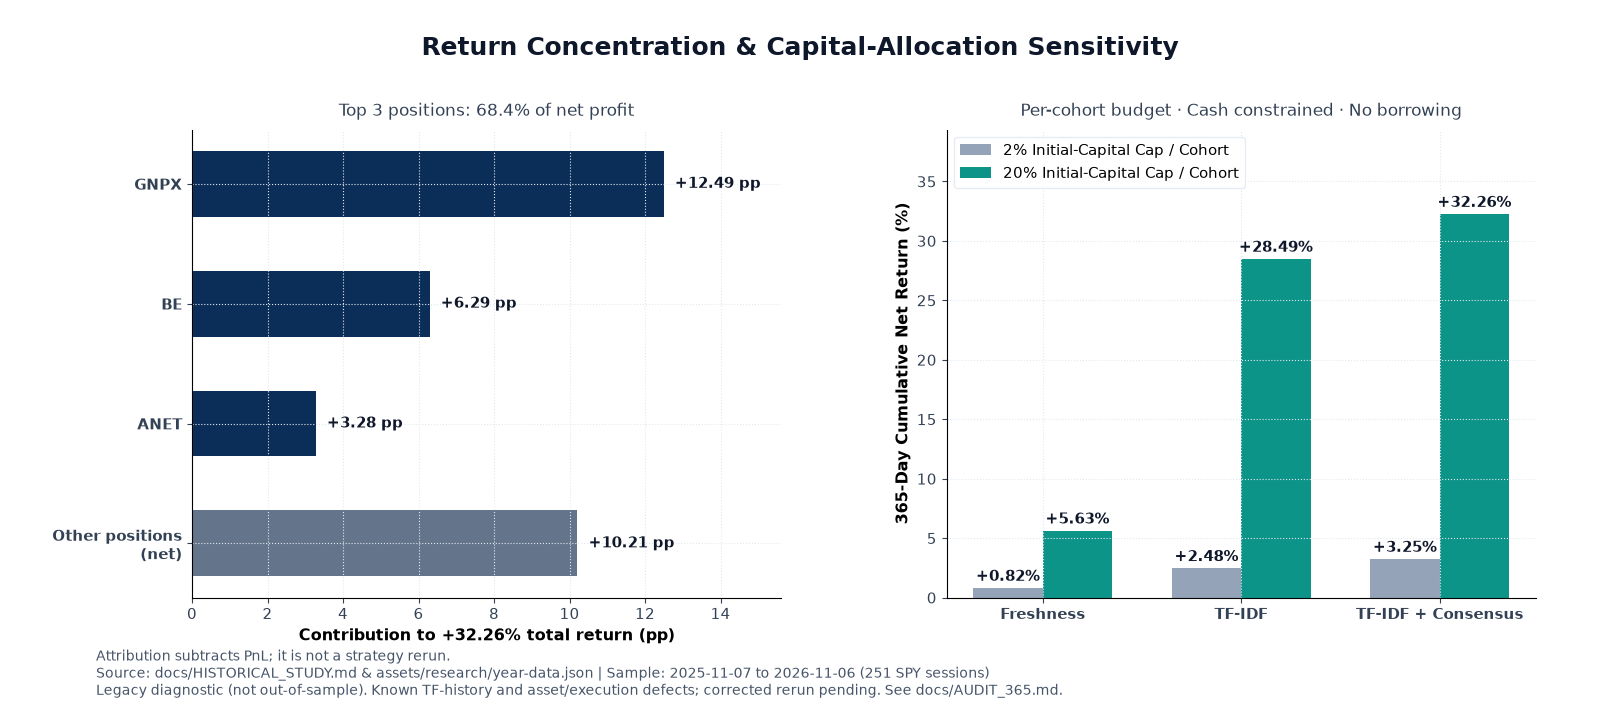
The three largest winning positions explain 68.4% of net profit: GNPX contributed 12.49 percentage points, BE 6.29 points, and ANET 3.28 points. That concentration is central to interpreting the headline.
Subtracting their original PnL leaves +10.21% as an arithmetic residual. Removing those signals and resimulating the cash ledger gives +6.12%, without substituting second-ranked candidates. The answers differ because removing a position changes the cash available for subsequent trades.
Allocation matters too. With a 2% initial-capital cap per cohort, the consensus variant returned +3.25%, with 1.47% drawdown. At the 20% cap, the corresponding figures were +32.26% and 9.85%. This is sensitivity to cash usage and which trades get funded, rather than a return independent of allocation choices.
What the audit changes
The audit is part of the project. Reproducing a number from frozen outputs and establishing a reliable investment signal are different achievements.
The original TF construction lost distinct transaction dates when several trades appeared in the same disclosure batch. Rebuilding the full history changed the top-ranked selection on 11 of 160 filing days for TF-IDF and 10 of 160 for the consensus variant. Corrected portfolio returns still require a complete rerun.
The comparison universe also contained a bond ETF labeled as stock, and the freshness simulation included a trade using prices on zero-volume dates. A nonempty price field does not prove that a simulated transaction could have been executed. Retrospective filing timestamps and daily-bar liquidity assumptions add further uncertainty.
Finally, historical rule exploration overlaps this evaluation window. Even a completely repaired implementation would still need untouched data and forward observation before supporting claims about future performance. The project preserves these limitations alongside the attractive result.
What is open source today
Congress Signal Lab provides an offline Python scoring and event-evaluation toolkit, local data adapters, synthetic examples, and audit documentation. The prepared version includes 42 software tests, plus figures and frozen derived NAV summaries that readers can use to check the displayed arithmetic.
The portable package produces event returns, not the annual cash-funded portfolio NAV. Its synthetic demo does not reproduce the +32.26% headline. Raw vendor datasets and the separate annual research engine are not distributed with it. Code is MIT-licensed; third-party data rights are separate.
Useful starting points:
- Methodology and input contract.
- Original annual study, derived data, and reproducibility boundaries.
- Open audit findings, source notices, and related projects.
What excites me is the translation between two domains: a familiar information-retrieval method gives us a precise way to describe distinctive investment behavior. The next challenge is to determine whether that description contains useful information after disclosure, costs, market exposure, and implementation errors are accounted for.
Disclaimer
This independent project is for research and education only. It is not investment, financial, legal, or tax advice, or a recommendation to trade. Backtests are hypothetical; historical or simulated performance does not guarantee future results, and investing can result in loss of capital. Data and software may contain errors. The project is not affiliated with or endorsed by Congress, any government agency, any member of Congress, or any data provider. A score or trading pattern does not establish insider information or wrongdoing. See the repository disclaimer and license for further details.